Observability
Logging tells you what happened. Observability tells you why a request cost 12 cents instead of 2, or took 8 seconds instead of 1.
What to observe
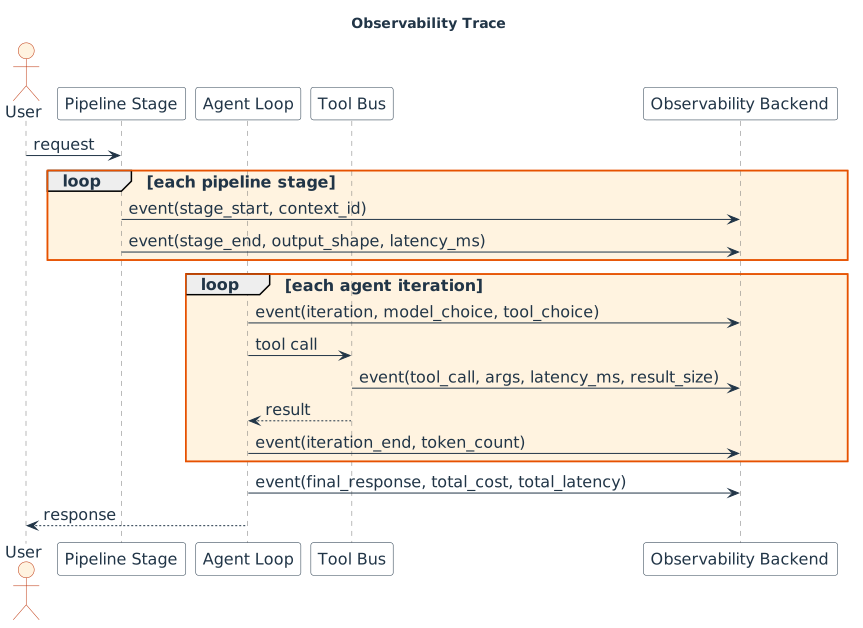
Every significant event in the pipeline and loop should be visible:
- stage start/end,
- validation and security decisions,
- model selection,
- tool calls, arguments, results, and latencies,
- loop iterations and guardrail triggers,
- final response cost, latency, and token counts.
OpenTelemetry and semantic conventions
The OpenTelemetry GenAI Special Interest Group defines gen_ai.* attributes that make LLM and agent telemetry portable across backends [OpenTelemetry, 2025; Uptrace, 2026]. Using them avoids vendor lock-in and custom parsing rules.
| Attribute | What it carries |
|---|---|
gen_ai.system |
Provider (openai, anthropic, google_vertex_ai) |
gen_ai.operation.name |
Operation type (chat, text_completion, embeddings) |
gen_ai.request.model / gen_ai.response.model |
Requested and actual model |
gen_ai.usage.input_tokens / gen_ai.usage.output_tokens |
Token counts |
gen_ai.response.finish_reasons |
Why generation stopped |
For agents, each LLM call, tool invocation, memory operation, and sub-agent handoff becomes a child span in a hierarchical trace. A single agent.run trace can expose exactly where time and tokens are spent [Uptrace, 2026].
Metrics that matter
| Metric | Why it matters |
|---|---|
| Cost per request | Catches runaway loops and context bloat. |
| Latency per stage | Identifies slow retrievals or model calls. |
| KV-cache hit rate | A 10× cost multiplier between cache hit and miss. |
| Tool call distribution | Spots repeated or wrong tool usage. |
| Guardrail trigger rate | Measures how often autonomy is constrained. |
| Escalation rate | Tracks when the agent gives up. |

Tracing, spans, and privacy
Agent observability requires span-level tracing, not just logs and scalar metrics. Traditional logs capture discrete events; an agent's behavior is non-deterministic, so you need causal chains across prompts, tool calls, memory reads, and handoffs [MLflow, 2026].
| Concern | Do | Don't |
|---|---|---|
| Prompt content | Store as span events with a size cap; sanitize PII | Store full prompt text as indexed attributes |
| Span naming | Use standard names like gen_ai.chat, agent.tool_call |
Encode user IDs or query text in span names |
| Token tracking | Separate input/output/reasoning counters | Use a single "total" counter |
| Cross-service tracing | Propagate traceparent through every HTTP call |
Break traces at tool boundaries |
| Sampling | Tail-based sampling: 100% errors, 5–10% successes in production | Head-based-only sampling that misses rare failures |
When dashboards lie
A green dashboard is not a guarantee. Standard backend metrics can miss the failure modes that are specific to agents.
A support agent at one company was moved from a standard model to a reasoning model. The dashboard reported output tokens and cost per request correctly, but it did not count the model's hidden reasoning tokens. Billing from the provider counted them. The dashboard showed a 300-token answer; the provider billed tens of thousands of reasoning tokens. The real cost was 40× higher than the dashboard suggested, and the gap was caught only because an engineer compared the provider bill to the dashboard by hand.
Reasoning and hidden tokens
Reasoning models (o-series, extended-thinking modes) bill for hidden reasoning tokens that do not appear in the visible output. OpenTelemetry added gen_ai.usage.reasoning.output_tokens in 2026 precisely because dashboards that only count visible output miss the real cost [OpenTelemetry Semantic Conventions, 2026; Uptrace, 2026].
| What to track | Where it lives |
|---|---|
| Visible output tokens | gen_ai.usage.output_tokens |
| Hidden reasoning tokens | gen_ai.usage.reasoning.output_tokens |
| Total cost | (input + output + reasoning) × price per token |
Cost per completed task is the metric that survives loops, retries, and hidden reasoning. Sum every LLM call, tool call, retry, and hidden reasoning token across the full session before reporting cost [Ibrahim, 2026].
This is why observability is a discipline, not a checklist. Every time the product shows strange behavior, you discover a blind spot and add a new metric. The maturity is not in having every metric on day one; it is in continuously adding visibility as the system teaches you what to measure.
Klarna: green volume, falling quality
In 2024 Klarna announced that its AI assistant handled work equivalent to 700 employees and saved $40 million per year [Forbes, 2024]. In May 2025 it acknowledged that full replacement had been too aggressive: quality dropped and it had to rehire staff [Fortune, 2025]. The likely gap was not a single missing metric, but a mismatch between what was measured (tickets closed, cost per interaction) and what mattered (customer satisfaction, NPS, actual resolution quality). Green volume metrics hid a quality regression.
Agent-specific metrics
The following metrics are not on a standard backend dashboard, but they are critical for agents:
| Metric | Why it matters |
|---|---|
| Tool call success rate (per tool) | One tool can silently return empty or degraded results while the overall completion rate stays green. Track per-tool success and p95 latency. |
| Bad-loop detection | An agent can repeat semantically similar searches with minor wording changes and burn tokens while every tool call returns 200. Measure semantic distance between consecutive tool requests. |
| Context utilization / compaction rate | A high compaction rate risks dropping critical instructions; under-utilization means you are paying for context headroom you do not use. |
| Tool choice quality | Did the agent call search_email when get_calendar was the right tool? Use an evaluator or user feedback to score. |
| Cost per completed task | Sum all LLM, tool, and retry costs across a full task or session. This is the metric that survives loops, retries, and hidden reasoning tokens. |

Sampling and storage
LLM calls are slow (100ms–30s) and produce large spans. Storing 100% of production traces is usually too expensive and too noisy [Uptrace, 2026]:
| Scenario | Strategy |
|---|---|
| Development | AlwaysOn: 100% sampling |
| Production successful calls | TraceIdRatioBased: 5–10% |
| Production errors | Tail-based: 100% |
| High-token requests (>2k tokens) | Tail-based attribute filter: 100% |
| Full agent runs | Tail-based: 100% (rare and high-value) |
Store full prompts and completions as span events, not attributes. Attributes are indexed, have size limits, and can leak PII into the observability backend. Events can be filtered or dropped at the collector without touching application code [Uptrace, 2026].
Build it from day one
If you add observability after the first incident, you will have no data for that incident. Instrument the pipeline when you build it, not after it breaks.
Deeper dive: agent telemetry and hidden signals
OpenTelemetry's GenAI semantic conventions give every span a portable shape, but the schema deliberately omits the most sensitive payload by default. A default GenAI span carries only gen_ai.request.model, token counters, and gen_ai.response.finish_reasons; prompt text, system instructions, tool arguments, and tool results are omitted unless content capture is explicitly enabled [OpenTelemetry, 2026]. That default is the right privacy posture, and it is also why a green span tree can still hide a bad answer. A tool span may record a 200 response with the correct tool name and call id, yet say nothing about whether the returned data actually answered the agent's question [Morph Team, 2026].
The span hierarchy itself is well defined: invoke_agent is the root, chat is each model call, and execute_tool is each tool invocation, with sub-agents ideally nested as child invoke_agent spans under the call that spawned them [Morph Team, 2026]. The catch is scale. A long agent run can produce hundreds of spans; the tree stays correct but becomes unreadable for the question most teams ask most often: "did this run go fine?" [Morph Team, 2026]. The signal therefore has to move from raw spans to derived signals: per-turn labels, LLM-as-judge scores, tool-result correctness, and cross-process sub-agent traces. Those signals are hidden only because you have to compute and attach them yourself.
Two places to add that telemetry are the model span and the tool span. On the model span, gen_ai.response.finish_reasons tells you why generation stopped; on the tool span, the response status and content summary tell you what the agent received. The gap between those two is where autonomy failures hide. A small set of extra attributes or events closes it:
| Signal | Where to record | Why it matters |
|---|---|---|
| Tool result correctness | execute_tool span event or attribute |
A 200 response can still be wrong, empty, or stale. |
| Sub-agent trace parent | invoke_agent child span across process boundaries |
Prevents a long tool-call blob from hiding nested work. |
| Per-turn quality score | chat span attribute |
Captures whether the model step moved toward the goal. |
| LLM-as-judge score | Root invoke_agent span or custom metric |
Summarizes run success without expanding 200 spans. |
These hidden signals are not part of the base convention yet, but they are the practical layer that turns a correct tree into a useful diagnosis.
References
- Ibrahim, M. "What Is Agent Observability?" Towards AI, Apr 2026. https://pub.towardsai.net/what-is-agent-observability-traces-loop-rate-tool-errors-and-cost-per-successful-task-dda2287f6c83
- IBM Research. "Unsupervised Cycle Detection in Agentic Applications." ICPE 2026. https://research.ibm.com/publications/unsupervised-cycle-detection-in-agentic-applications
- Forbes. "Klarna's AI Assistant Is Doing The Job Of 700 Workers." Mar 2024. https://www.forbes.com/sites/jackkelly/2024/03/04/klarnas-ai-assistant-is-doing-the-job-of-700-workers-company-says/
- Fortune. "As Klarna flips from AI-first to hiring people again." May 2025. https://fortune.com/2025/05/09/klarna-ai-humans-return-on-investment/
- Maxim. "7 Metrics You Should Track for AI Agent Observability." May 2026. https://www.getmaxim.ai/articles/7-metrics-you-should-track-for-ai-agent-observability/
- MLflow. "What Is Agent Observability? A 2026 Developer Guide." Jun 2026. https://mlflow.org/articles/what-is-agent-observability-a-2026-developer-guide/
- OpenTelemetry. "AI Agent Observability - Evolving Standards and Best Practices." Mar 2025. https://opentelemetry.io/blog/2025/ai-agent-observability/
- OpenTelemetry Semantic Conventions. "genai: define reasoning tokens attribute." Feb 2026. https://github.com/open-telemetry/semantic-conventions/pull/3383
- Uptrace. "OpenTelemetry for AI Systems: LLM and Agent Observability (2026)." Apr 2026. https://uptrace.dev/blog/opentelemetry-ai-systems
- Zhang, X., et al. "When Agents Do Not Stop: Uncovering Infinite Agentic Loops in LLM Agents." arXiv, 2026. https://arxiv.org/html/2607.01641
- Zalesov, A. "A Practical Memo on Building LLM Agents." May 2026. https://medium.com/@zallesov/a-practical-memo-on-building-llm-agents-cc5179cb2e50
- Manus. "Context Engineering for AI Agents: Lessons from Building Manus." https://manus.im/en/blog/Context-Engineering-for-AI-Agents-Lessons-from-Building-Manus
- Morph Team. "Agent Tracing with OpenTelemetry (2026): How It Works and the Tools." Morph, Jun 2026. https://www.morphllm.com/agent-tracing
- OpenTelemetry. "Inside the LLM Call: GenAI Observability with OpenTelemetry." May 2026. https://opentelemetry.io/blog/2026/genai-observability/